How to read an ECG: Perspectives for the new nurse or nursing student.
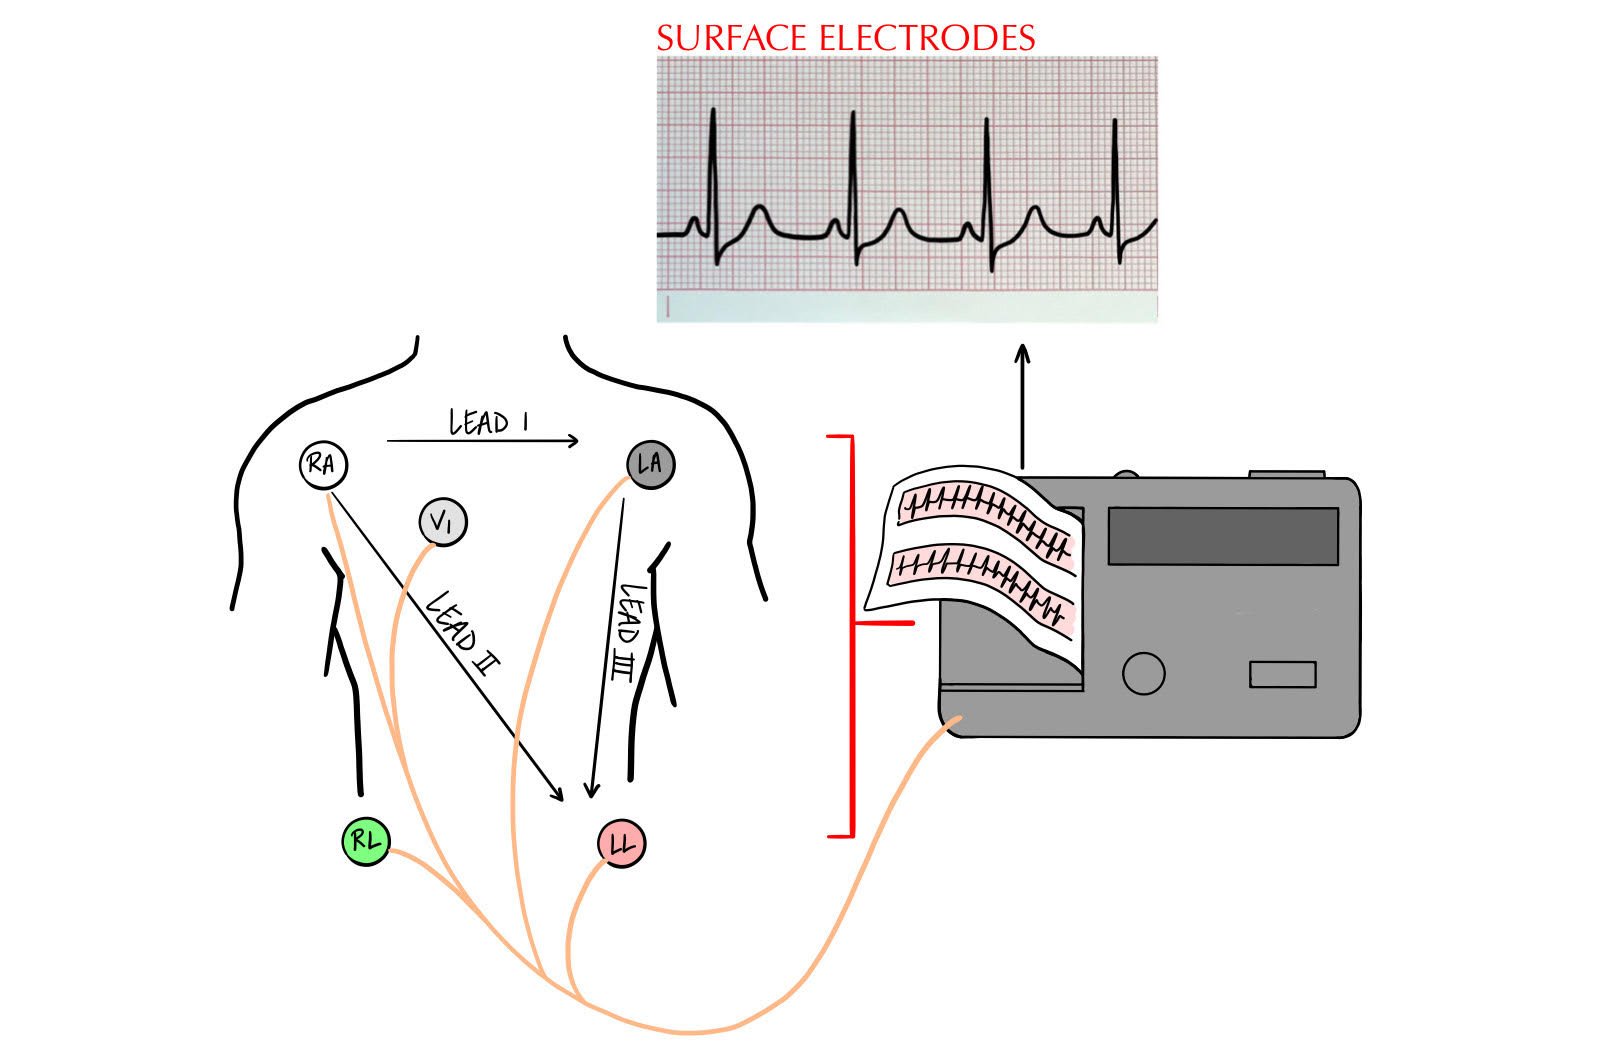
An electrocardiogram (ECG or EKG) is an electrical rendition that tells the story of the physical events occurring in the heart with each beat (electro = electrical, cardio = pertaining to the heart, gram = record or picture). Surface electrodes are placed on the skin at specific anatomical positions that provide a recording of electrical activity below the surface.
What does this mean?
The ECG is a diagnostic tool, useful for detecting abnormal conditions. These abnormal conditions include conduction abnormalities and arrhythmias. Arrhythmia is the term used to describe abnormal cardiac rhythms and their importance is directly related to their effect on total cardiac output (among other factors).
Why should we care?
Electrocardiograms help guide treatment for both emergent events and chronic conditions. These longitudinal changes may be the result of genetic predispositions, medication therapies, structural changes, tissue death, conduction delays of electrical origin, and more. For the bedside nurse working in cardiac telemetry, intensive care, or other units, spotting early and/or subtle variations on the patient’s ECG may result in earlier provider notification, expedited interventions that may be needed, and better patient outcomes. When first learning to read and interpret ECGs however, laying a solid foundation is paramount. This foundation is presented here in the form of standardizing the rhythm interpretation process.
Let’s quickly review the mechanical events associated with each part of the electrical rendition presented on the ECG:
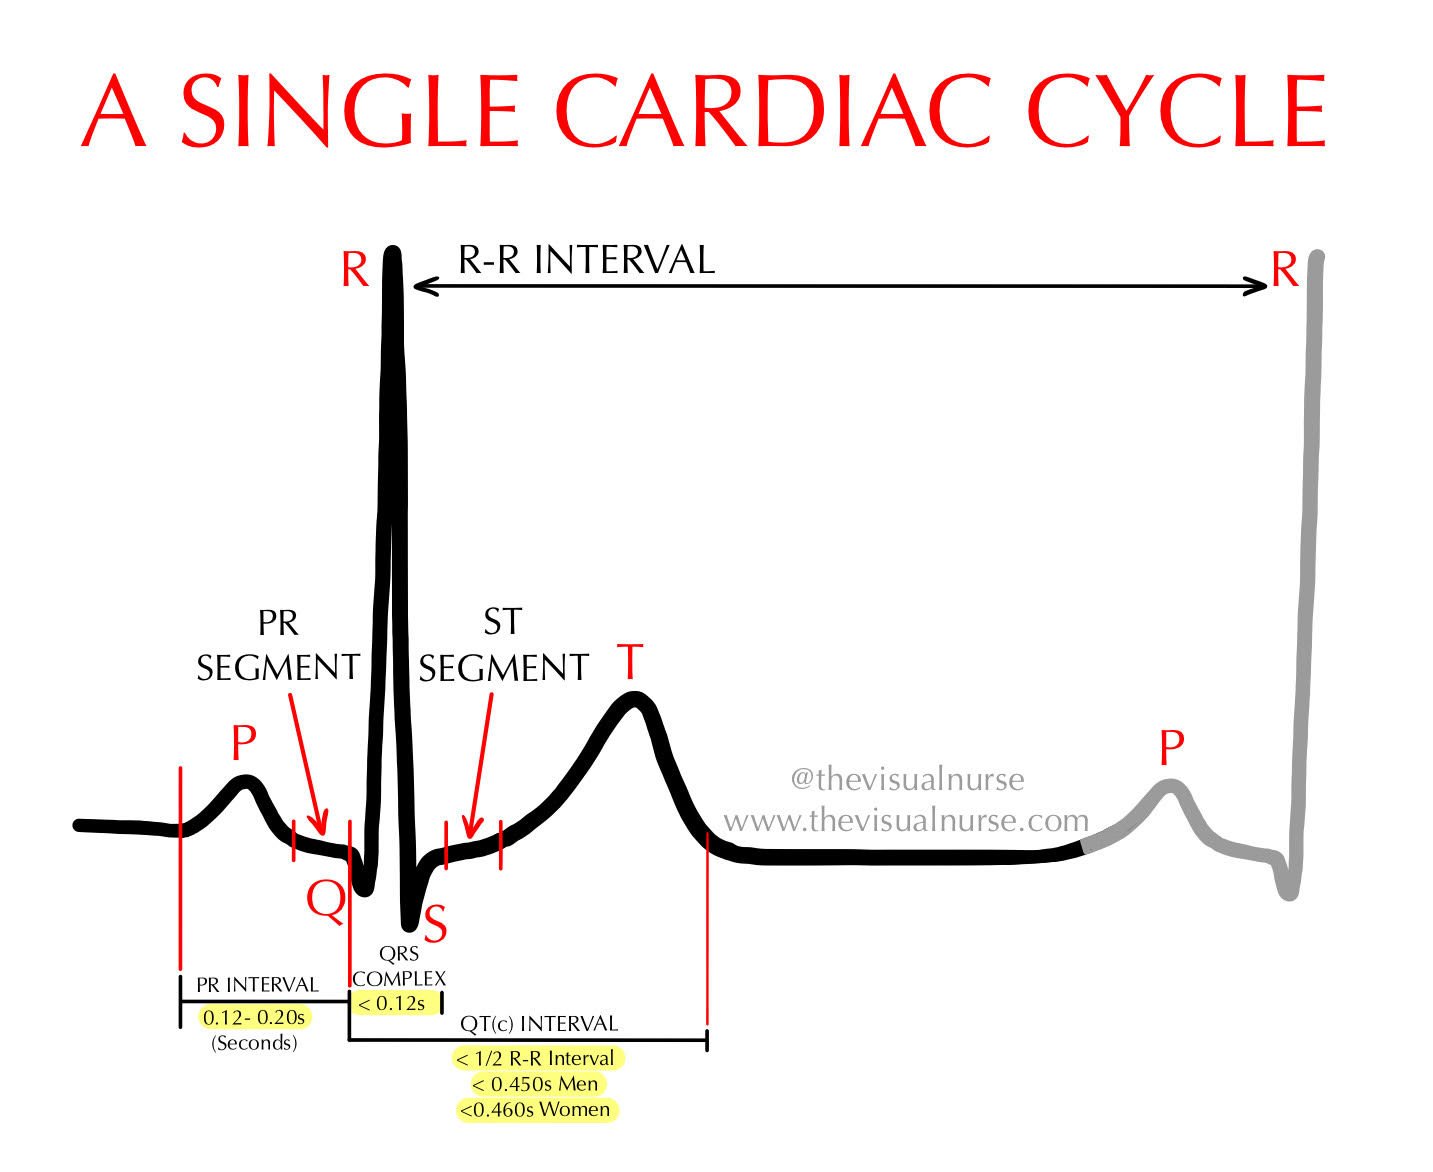
First to the party: The P wave. The P wave is the first positive deflection in the cardiac cycle (PQRST) and represents Sino-atrial (SA) node and atrial depolarization. The single most important lesson we can impart here is that the P wave represents atrial depolarization and contraction, and the QRS complex represents ventricular depolarization and contraction. This is important because the SA node is what we refer to as the "pacemaker" of the heart. It quite literally sets the pace for the timing of each cardiac cycle.
Following (and also encompassing) the P wave, is The PR interval. This part of the cardiac cycle describes the time needed for the impulse to leave the SA node and arrive at the Atrio-ventricular (AV) node. This represents the initiation of atrial depolarization (the P wave) and ends with depolarization through to the AV node (just before the QRS complex). It should be constant in length and between 0.12 and 0.20 seconds. During this time, the atria are fully contracting and emptying into the ventricles.
In fact, the iso-electric (flat) P-R Segment following the P wave represents a slight delay of the impulse at the AV node. This allows for complete ventricular filling before progression to the QRS complex (ventricular activation).
The QRS complex. We've made it to the ventricles. Following a slight delay at the AV node, the electrical impulse is ready to travel down the bundle of His, into to the left and right bundle branches, and terminally to the Purkinje fibers. The QRS complex represents this, indicating depolarization and contraction of the ventricles. This complex is short in duration (≤ 0.12 seconds).
This is largely thanks to the Purkinje fibers, where the impulse picks up a lot of speed. This is important since the ventricles are relatively thick and need to depolarize almost simultaneously to allow as much blood as possible to be expelled.
Following the QRS complex is the ST segment. Before looking at this diagnostic segment we should first understand the J point. The J point is the point at which the S wave of the QRS makes the turn to head back to baseline (J joins the S with the T). This is important because this marks the beginning of the ST segment.
The normal ST segment should be flat (isoelectric) at baseline. We evaluate this by using the PR segment (or sometimes the P-Q junction with rapid heart rates) as the isoelectric starting point. Remember that the PR segment represents the point at which the atria have fully contracted and the heart is now electrically neutral. To evaluate if the ST segment falls above, in line, or below the PR segment draw a straight, horizontal line from one to the other. Generally speaking, one small box (0.04 seconds; 1 mm) above or below the isoelectric line is considered abnormal.
The T wave represents ventricular relaxation and repolarization. At this point, the ventricles are refractory, meaning they’re unable to respond to any incoming impulses and are not able to discharge. During this period, the cells of the heart are in the process of recharging for the next impulse and wave of contraction. Sometimes, you may see a premature atrial beat (P wave) delivered and the ventricles will not respond. It can sometimes mimic a transient heart block so take a closer look. Essentially the ventricles are saying, "Nope, we just contracted and we're on break, so send another sinus beat in a few seconds and we'll pick that one up."
And finally, The QT interval (QTI) represents a single ventricular cycle of contraction and relaxation. If you recall the previous letters of the cardiac cycle and what each represents, this will tell you exactly what the QT interval is describing. The “Q” of the QRS complex represents the beginning of ventricular activation and contraction. The T wave represents ventricular relaxation and repolarization. Together, the QTI describes the time the entire process takes.
Speaking of time, what are the acceptable intervals for this measure? Broadly, the QT interval should be less than half the R to R interval. More specifically, the QTI should be ≤ 0.44 seconds in men, and ≤ 0.46 seconds in women. Women are known to have longer QT intervals when corrected for rate compared to their male counterparts, although the mechanism is not fully understood.
Read on to discover the 8 step process used to outline this. We’re almost there…

Great, so how do we standardize this?
Pictured above is the 8 step rhythm analysis format that I use every day. The absolute key to learning rhythm analysis is using the same stepwise progression every single time. This prevents us from becoming overwhelmed when we encounter the myriad of information presented within a single rhythm strip. Of course with practice, your eyes will learn to quickly skim and summarize these steps as second nature but first, we have to build the foundation that allows us to train our eyes over time.
Rhythm analysis can resemble a tangled mess of wires (like the ones you pull out of your attic each year around the holidays) or it can take on the appearance of the clean, streamlined, and labelled wires associated with a well organized commercial computer server system. It’s up to you.
What does this mean?
Ultimately, it will be up to you to decide how difficult or easy rhythm interpretation will be. It’s up to you to practice and use this process daily until you can repeat it without thinking. I recommend doing at least one sample rhythm strip each day using this approach. Set a daily timer if you need to. It should only take 5 minutes of your day but by doing so, your axe will become a little sharper with each strip that you see and eventually your eyes will begin to read the strips as you’re reading this paragraph. Remember, long term consistency beats short term intensity and practice makes perfect.
Why should we care?
How do we keep from getting tangled up? Say the following with me: “R, P, and Q times two (x2)… STAT!” This mnemonic describes the progression that we’ll follow. If you’re visual like me, here’s an illustrative example…

“R, P, and Q times two (x2)… STAT!”
Rate: What’s the heart rate in beats per minute?
Rhythm (regularity): Is the rhythm regular or irregular, meaning “Do the P waves and QRS complexes march out routinely?”
P waves: Are they present? What’s the appearance?
PR: What does the PR interval measure?
QRS: What does the QRS interval measure? Is it narrow or wide?
QT: What does the QT interval measure?
ST: Is the ST segment elevated, depressed, or in line with the PR segment?
T: Are they normal and upright or are they abnormal (peaked, flat, inverted, or biphasic)?
The trick is to follow the same process each time when first learning rhythm interpretation. Don’t be lured into getting tangled up in all of the information that a rhythm strip provides by jumping to step 6. Don’t step over nickels to pick up pennies. Sharpen your axe daily.
TAKE HOME POINTS:
The key to learning rhythm analysis is using the same progression every time
Practice at least one sample rhythm strip each day using the same approach
Remember RPQ x 2 STaT: Rate & Rhythm, P & PR, QRS & QT, ST & T